


How to Make a Gantt Chart in 2025: A Comprehensive Guide
Introduction
In today’s fast-paced business environment, project management has become essential for organizations of all sizes. A Gantt chart is a powerful tool that plays a vital role in project management, providing a visual representation of project tasks, timelines, and dependencies. By understanding how to make a Gantt chart, you can effectively plan, track, and manage your projects, leading to improved efficiency, reduced risks, and successful project outcomes.

Step 1: Gather Project Information
Before creating a Gantt chart, it is crucial to gather all the necessary project information. This includes:
1. Task list: A detailed list of all the tasks that need to be completed
2. Task duration: The estimated time it will take to complete each task
3. Task dependencies: Any tasks that are dependent on others and cannot be started before they are completed
4. Project start date: The date on which the project is scheduled to begin
5. Project end date: The target date for project completion
Step 2: Create a Spreadsheet
The most common way to create a Gantt chart is using a spreadsheet program such as Microsoft Excel or Google Sheets. Open a new spreadsheet and create the following columns:
1. Task Name
2. Start Date
3. End Date
4. Duration
5. Progress
6. Notes
Step 3: Fill in the Spreadsheet
Enter the task list, duration, and start and end dates for each task in the corresponding columns. For task dependencies, use a formula to link related tasks. For example, if Task B is dependent on Task A, you can use the formula “=A2+Task A Duration” in the Start Date column for Task B.
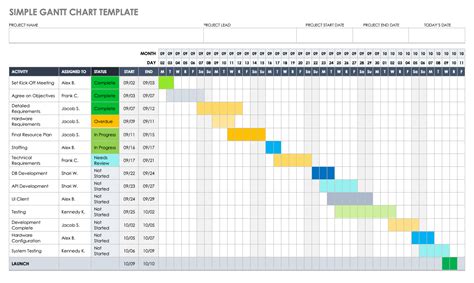
Step 4: Create a Gantt Chart
Once the spreadsheet is complete, you can create a Gantt chart by selecting the data and clicking on the “Insert” tab in the ribbon. Choose “Chart” and select the “Gantt” chart type. The Gantt chart will be automatically generated, displaying the tasks, timelines, and dependencies graphically.
Step 5: Customize the Chart
To customize the Gantt chart, you can adjust the colors, fonts, and scales to suit your preferences. You can also add additional features such as milestones, summary tasks, and task notes to enhance the chart’s clarity and usefulness.
Tips for Making Effective Gantt Charts
- Use realistic task durations to avoid delays and setbacks.
- Clearly define task dependencies to ensure that tasks are completed in the correct order.
- Update the Gantt chart regularly to reflect progress and any changes to the project plan.
- Communicate the Gantt chart to team members and stakeholders to keep everyone informed and aligned.
- Use Gantt chart software for advanced features and collaboration capabilities.
Benefits of Using Gantt Charts
- Improved project planning and scheduling
- Reduced project risks and delays
- Enhanced resource allocation and utilization
- Clear communication and collaboration
- Increased project success rates
The Future of Gantt Charts
Gantt charts are constantly evolving to meet the demands of modern project management. Future trends include:
- Integration with project management software
- Real-time updates and data visualization
- Advanced analytics and reporting capabilities
- Artificial intelligence-driven insights and recommendations
Conclusion
In conclusion, understanding how to make a Gantt chart is an invaluable skill for project managers and team members alike. By following these steps and incorporating the tips and future trends discussed, you can leverage the power of Gantt charts to plan, track, and manage your projects effectively, ultimately maximizing productivity and achieving successful project outcomes.
Table 1: Gantt Chart Key Features
| Feature | Description |
|---|---|
| Task list | A comprehensive list of all project tasks |
| Timeline | Visual representation of task start and end dates |
| Dependencies | Links between tasks that show the order in which they must be completed |
| Progress tracking | Indicates the percentage of completion for each task |
| Customization | Ability to adjust colors, fonts, and scales to suit preferences |
Table 2: Benefits of Gantt Charts for Project Management
| Benefit | Impact |
|---|---|
| Improved planning and scheduling | Reduces project delays and setbacks |
| Enhanced risk management | Identifies and mitigates potential project risks |
| Optimized resource allocation | Ensures efficient use of resources and avoids bottlenecks |
| Clear communication | Facilitates collaboration and understanding among team members and stakeholders |
| Increased project success rates | Helps teams achieve project goals on time and within budget |
Table 3: Tips for Effective Gantt Chart Creation
| Tip | Purpose |
|---|---|
| Break down large tasks into smaller ones | Improves clarity and reduces complexity |
| Add buffers for unexpected events | Allows for flexibility and prevents delays |
| Use colors and symbols to visually differentiate tasks | Enhances usability and makes the chart easier to read |
| Monitor progress regularly and make updates | Ensures accuracy and reflects changes to the project plan |
| Share the Gantt chart with stakeholders | Keeps everyone informed and aligned on project status |
Table 4: Future Trends in Gantt Chart Technology
| Trend | Potential Impact |
|---|---|
| Integration with project management software | Improved functionality and collaboration |
| Real-time updates and data visualization | Enhanced decision-making and project control |
| Advanced analytics and reporting | Granular insights and data-driven decision-making |
| Artificial intelligence-driven insights | Automated recommendations and improved efficiency |